Synthesis Theory I: Final Exam
You may use any inanimate resource for this final, except a
resource generated by another student during the semester such as their
class notebook. Your exalted instructor is the only human you may
communicate with about this exam until it is done. The exam is due by 10
a.m. sharp in room 316C next Friday. The exam may not be turned
in late.
- Soundfiles: If a soundfile is sampled at 44.1 kHz, and the
soundfile is stereo and each sample is two byte (or 4 bytes for
each stereo pair), then how many bytes of sound data are there
in one second of sound? How many bytes are there in one minute
of sound? In an hour?
| Answer: |
   44100 samples    2 bytes
   ------------- *  ------- * 2 channels =  176,400 bytes/sec
    second          sample
    176,400 bytes/sec  * 60 sec/min     =  10,584,000 bytes/min
    10,584,000 bytes/min  * 60 min/hour = 635,040,000 bytes/hour
|
- Extra Credit: If an audio CDROM can hold 650 MB of stereo
audio at a sampling rate of 44.1 kHz, and each sample is two bytes
(i.e., 4 bytes for each stereo sample pair), how many seconds
of audio can be stored on an audio CD? How many minutes is that?
| Answer: |
650,000,000 bytes / 4 / 44100 = 3,684.8 seconds
                              =    61.4 minutes
Actually, regular CDs can hold about 74 minutes of audio. Why do
CD-ROM blanks say they hold 650 MB? This is because they list the size
of the CD available for computer applications which is less due to formatting,
lead-in and lead-out gaps, and hopefully error-correction mechanisms.
If a CD can hold 74 minutes of stereo 16-bit audio at 44.1 kHz, then
this means that it can hold 783,216,000 bytes of audio data.
|
- Soundfiles (2): What is this: 0xff and what does it mean?
| Answer: |
0xff is the representation of a hexadecimal number in the C
programming language. It is equivalent to the decimal number 255, or
the binary number 1111,1111.
|
- Wavetables: If a soundfile is stored in a wave table and played
back with a wavetable increment of 1, then each sample is played back
and the resulting sound is the same as the original recording. If the
wavetable increment is 2, then the resulting sound will be an octave
higher because every other sample in the wave table is skipped.
What is the wavetable increment if you want the resulting sound to be
a perfect fifth above the original sound?
| Answer: |
A perfect fifth (in Just or Pythagorean tuning) is a ratio of 3/2 or
1.5. The wavetable increment with also be 1.5 samples/increment.
|
- Wavetables (2): Suppose you have a wavetable with 1000 samples.
Now suppose you have just played sample 362 in the wavetable and you are
playing the wave table with an increment of 1.2. Then the next sample you
will have to play is 363.2. But you only have the sound sample for 365
and 364. What are you going to do? Name the two simplest interpolation
methods used to deal with this problem.
| Answer: |
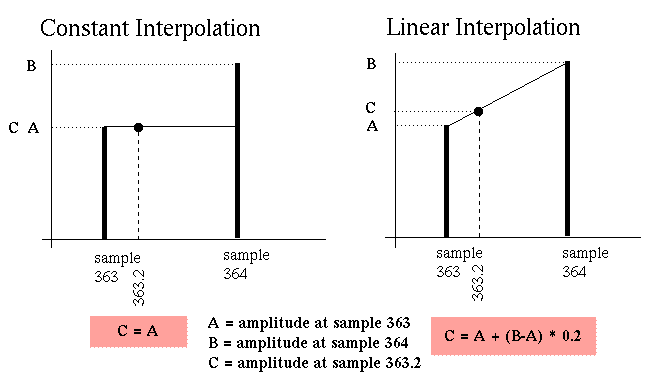
The two simplest interpolation methods are (1) constant interpolation
and (2) linear interpolation. Since the sample you need to play is
located at 363.2 samples in the wavetable, there is a problem: there
is no value for that sample since it is somewhere between the two
data points in the table. The easiest way to determine the amplitude
of the sample 363.2 is to just use the value at location 363. This is
called constant interpolation because all of the intermediate
amplitudes between samples 363 and 364 will be equal to the amplitude
of sample 363.
The next most simplest method of interpolation will get rid of half
of the interpolation noise: linear interpolation. This is done by
drawing a line between the sample amplitudes at samples 363 and 364.
Then to calculate the amplitude at sample 363.2, you find the point
on the line between integer samples which is above sample position
363.2. This can be done with the equation:
C = A + (B-A) * 0.2
where A is the amplitude at sample 363, B is the amplitude at
sample 364, C is the amplitude at sample 363.2, and 0.2 is the
fraction of the distance between 363 and 364 at which point you are
searching for an amplitude.
Here is a picture showing the two interpolation methods:
|
- Filter types: What is the difference between a linear and
nonlinear filter? In other words, how does each type of filter
affect the frequencies of the input signal?
| Answer: |
A Linear filter can only change the amplitudes of the input sound,
either making them louder or softer. It cannot create new frequencies
which are not present (have an amplitude of 0) in the input sound.
A non-linear filter may generate new frequencies which are not
the same as the frequencies in the input sound to the filter.
|
- Filter types (2): Name two linear filters we covered in class.
Name two non-linear filters we covered in class.
| Answer: |
- linear filters: averaging filter, comb filter, DC-blocking
filter, one-pole filter, one-zero filter, allpass filter, resonating
filter, bi-quad filter, reverberation, etc.
- non-linear filters: ring modulation, FM synthesis, granular synthesis, transposing
wavetable synthesis.
|
- Linear filters: What are the three mathematical operations which
can be done on a signal in a linear filter?
| Answer: |
- add: two signals may be added together.
- scale: a signal may be scaled by a constant value to increase or
decrease its amplitude.
- delay: a signal may be delayed in time.
Note that none of these operations will add new frequencies to an
input sound. One operation which is not allowed:
- multiplication: two signal cannot be multiplied together in
linear filters (this is ring modulation).
|
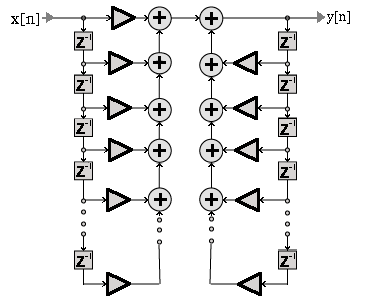
- Linear filters (2): Draw the flow-graph schematic of a generalized
linear filter.
| Answer: |
| input signal |
|
output signal
|
All linear filters can be put into this form wich is useful for
determining the difference equation of the filter.
|
- Reverberation: Is reverberation a linear or non-linear filter? Why?
| Answer: |
Reverberation is a linear filter because no new frequencies are
created by the reverberation (your voice does not change pitch
depending on what type of room you are in does it?).
The elements in a reverberator are scaling (sound hitting a wall and
losing energy), adding (sound from different walls mix together), and
delay (reflections of sound from different walls take different
amounts of time to get to your ear). Since only these three types of
filter elements are needed for reverberation, you have the same filter
elements that linear filters are created from.
|
- Filters: Explain these terms: "flowgraph", "difference equation",
"transfer function", "frequency response", "pole-zero diagram".
How do these terms relate to filters? How do these terms relate to
each other? Only a top-level (i.e., vague) description is necessary,
and no mathematics are involved in the explanation.
| Answer: |
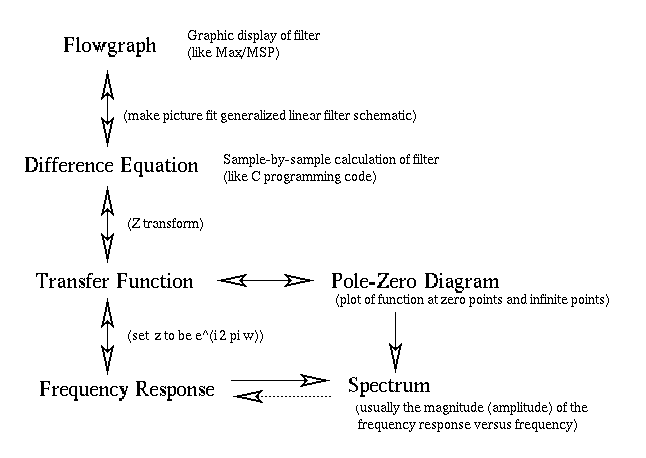
- a flowgraph describes how the sound flows through a
filter. It is exactly like the objects in a Max/MSP audio patch.
- a difference equation is equivalent to a flowgraph. It
demonstrates how to implement a filter in a program using a
programming language such as C, C++, matlab or Java.
- a transfer function can be derived from the difference equation
by taking the z-transform of the difference equation: replace all
ys with Ys and xs with Xs and
all [n-x]s with z^(-x)s. With a transfer function you
can draw a pole-zero diagram.
- a pole-zero diagram indicate where the transfer function goes to
zero or to infinity. Zeros are indicated on a complex plane as zeros,
and infinities are represented with x's.
All of these terms are different ways to describe how a (linear)
filter affects the frequencies of an input sound. If you have the
description of a filter in one of these forms, you can calculate
all other forms of a filter description.
Here is a road-map of the relationship between the terms:
|
- Extra Credit: If you were to implement a filter in a graphical
environment such as Max/MSP, which of the terms in the previous question
are relevant? If you were to implement a filter directly in C, which
of the terms in the previous question would be relevant?
| Answer: |
The flowgraph is the most direct implementation of a filter in
Max/MSP. The difference equation is the most relevant
description of a filter for implementing in the C language.
|
- Filters 2: What is the difference equation for the averaging filter (a
filter which takes the current sample and the last sample and outputs the
average of the two samples)? Draw the spectrum for the averaging filter.
| Answer: |
The difference equation for an averaging filter is:
y[n] = (x[n] + x[n-1])/2.
Below is the spectrum of the averaging filter. The averaging
filter will have no effect on a 0 Hz signal (try this 0 Hz signal in
the averaging filter: {1, 1, 1, 1, 1, 1, 1, 1, 1, 1, 1, 1,
1...}).
The filter will completely remove any signal at 1/2 of the sampling
rate (try this fs/2 Hz signal in the averaging filter: 1, -1, 1, -1,
1, -1, 1, -1, 1, -1, 1, -1, 1, -1}). For intermediate
frequencies, the filter will affect the signal somewhat at low
frequencies and will affect the signal greatly closer to fs/2 (half
the sampling rate).
In drawing the spectrum, you should note that at 0 Hertz, the
averaging filter does not affect the input signal. At fs/2 the
averaging filter will make the output of the filter all zeros.
For frequencies inbetween 0 and fs/2, there will be approximately a
straight line in the picture of the spectrum. Here is a picture
of the exact spectrum generated by the averaging filter:
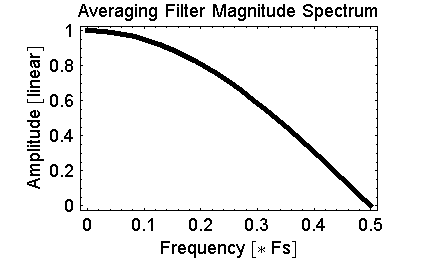
Here is the Mathematica code used to generate the above
spectrum plot:
H[freq_] := 1/2 + 1/(2 E^(I 2 Pi freq)
Plot[Abs[H[f]], {f, 0, 1/2}];
|
- Extra Credit: Draw the pole-zero diagram for the averaging filter.
| Answer: |
The pole zero diagram can be drawn by examining the
transfer function of the averaging filter: Y/X = (1 + z)/2z
. Where the function Y/X goes to zero, place a zero
on the pole-zero diagram. This occurs when z = -1:
      Y/X = (z + 1) / 2z
          = (-1 + 1) / -2
          = 0
There are no poles in the averaging filter because there are no values
of z which will cause Y/X to go to infinity.
Compare the pole-zero plot below with the spectrum of the averaging
filter in the previous question. Can you see how the spectrum is
derived from this pole-zero diagram?

|
- Pole-Zero Diagram: Draw the qualitative (approximate) spectrum (from
0 Hz to half the sampling rate) for the following pole-zero diagram:

| Answer: |
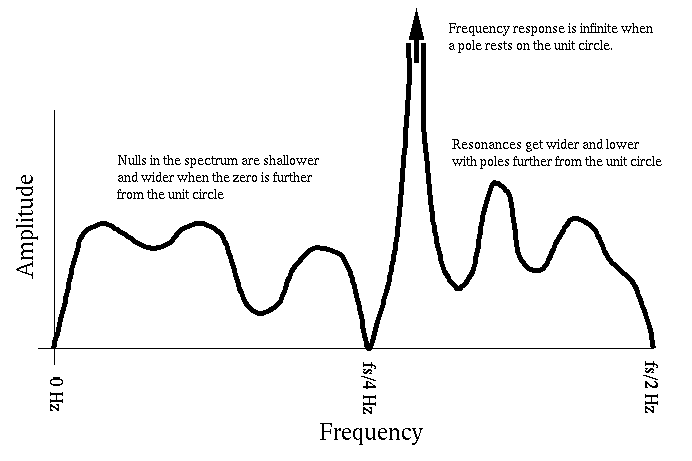
|
- Sinewaves and Hearing: What is the mathematical equation for
a sinusoid? What are the three physical variables in the equation?
How does these three variables relate to hearing?
| Answer: |
Mathematical definition of a sinewave: A sin(2 pi f t + phi)
| symbol | physical meaning |
perceptual meaning |
| A | amplitude | loudness |
| f | frequency | pitch |
| phi | Phase | Cannot be heard
under normal monaural conditions (can be heard when it causes
instantaneous amplitudes above the RMS amplitude of the signal). Can
also be perceived as spatial localization on the horizontal plane of
the ears. |
|
- Sinewaves and Mathematics: What is the mathematical definition
of a complex sinusoid?
| Answer: |
Euler's identity demonstrates two methods of calculating a complex
sinusoid:
e^(i x) = cos(x) + i sin(x)
The complex sinusoid can be thought of as a two-dimensional sinusoid.
One dimension contains a cosine wave, and the perpendicular dimension
contains a sinewave. Here is a picture of a complex sinusoid with
the third dimension being time:
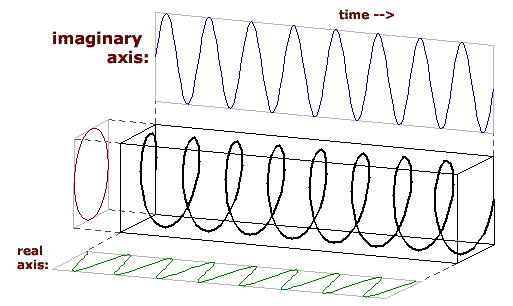
|
- Spectrum: What are the TWO steps that must be done to measure
the amplitude of a sinusoid in an audio signal?
| Answer: |
- Multiple the signal by a test sinusoid which has the same
frequency as the one you are searching for the amplitude of in the
test signal.
- Add the resulting signal, element by element to get the
amplitude of the frequency.
An optional third step is to normalize the amplitude. These steps
work for complex sinusoids in all situations, but only work with real sinusoids
in specific cases,
since sinewaves cannot see cosinewaves, and vice versa.
|
- Spectrum (2): How can the amplitude of a sinusoid with an
arbitrary phase be measured in an audio signal?
| Answer: |
let As = amplitude of a test sinewave with frequency f.
let Ac = amplitude of a test cosinewave with frequency f.
let A = amplitude of a sinewave with frequency f and phase phi
Then: A = sqrt( As * As + Ac * Ac)
|
- Spectrum (3): Here is an audio signal:
sample:  1     2      3     4      5     6     7      8      9     10
signal:  4.28, 0.34, -0.48, 3.91, -7.82, 2.55, 4.06, -5.50, -0.03, -1.30
Here is a picture of the signal (which repeats to the left and the
right):
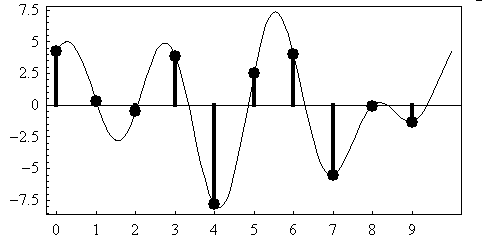 And here is a test sinewave, and a test cosinewave:
sample:  1    2      3      4      5     6    7      8      9     10
sine:    0,   0.95,  0.59, -0.59, -0.95, 0,   0.95,  0.59, -0.59, -0.95
cosine:  1,   0.31, -0.81, -0.81,  0.31, 1,   0.31, -0.81, -0.81,  0.31
Here is a picture of the test sinewave:

Here is a picture of the test cosinewave:
 (A) What is the amplitude of the test sinewave present in the signal?
(B) What is the amplitude of the test sinewave present in the signal?
(C) What is the amplitude of the sinusoid in the audio signal which
has the same frequency as the test sine and cosine?
(The normalization factor will be 5, so divided by 5 to find the
final amplitude of the sinusoids, or don't worry about normalization).
| Answer: |
- A: calculate the amplitude of the sinewave in the signal:
sample:   1     2      3     4      5     6     7      8      9     10
signal:   4.28, 0.34, -0.48, 3.91, -7.82, 2.55, 4.06, -5.50, -0.03, -1.30
sine:     0,    0.95,  0.59,-0.59, -0.95, 0,    0.95,  0.59, -0.59, -0.95
          ------------------------------------------------------------------
multiply: 0    +0.32 - 0.28 - 2.3 + 7.4 + 0   + 3.9  - 3.2 + 0.018 + 1.2
add:      7.037 = amplitude of the sinewave in the signal
(normalize): 1.41 = normalized amplitude of the sinewave in the signal
- B: calculate the amplitude of the cosinewave in the signal:
sample:   1     2      3     4      5     6     7      8      9     10
signal:   4.28, 0.34, -0.48, 3.91, -7.82, 2.55, 4.06, -5.50, -0.03, -1.30
cosine:   1,    0.31, -0.81, -0.81, 0.31, 1,    0.31, -0.81, -0.81,  0.31
          ------------------------------------------------------------------
multiply: 4.3 + 0.1  + 0.4 - 3.2 - 2.4 + 2.6 + 1.3 + 4.4 + 0.2 - 0.4
add:      7.068 = amplitude of the cosinewave in the signal
(normalize): 1.41 = normalized amplitude of the cosinewave in the signal
- C: calculate the amplitude of the unknown phased sinusoid
in the signal which has the same frequency as the sine and cosine
waves by using information from the previous question:
   amplitude = sqrt(sineamp^2 + cosineamp^2)
             = sqrt( 1.41^2 + 1.41^2)
             = 2.0
You could also have calculated the amplitude before normalizing the
amplitudes of the sine and cosine test signals.
|
- Extra Credit: What is the phase of the sinusoid in the signal
in the previous question which you just calculated the amplitude of?
| Answer: |
Notice that the amplitudes of the sine and cosine in the previous
problem were (approximately) equal to 1.41. The unknown phase of the
sinusoid in the signal can be calculated by knowledge of the
amplitudes of the sine and cosine test signals. The sine and cosine
test signals form a complex sinusoid when you stick an i in
front of the sine. The phase is the angle at which the amplitude of
the sine (on y-axis) and cosine (x-axis) match. Here is how the
phase of the sinusoid at the given frequency is calculated:
   phase = arctangent(1.41/1.41)
         = arctangent(1)
         = pi/4
         = 45 degrees
100 bonus points if you were able to figure out that one :-).
|
- Ring modulation: If the input signal into a ring modulator is
a 500 Hz sinewave and the modulator is a 60 Hz sinewave, what are the
output frequencies of the ring modulation that you will hear?
| Answer: |
There will be two frequencies in the output: 500 + 60 = 560 Hz and
500 - 60 = 440 Hz.
|
- FM Modulation: What is the mathematical equation for FM
Synthesis? What are the interesting control variables in the
equation?
| Answer: |
Equation for simple FM synthesis is:
A sin(2 pi c t + I sin(2 pi m t))
There are four interesting control variables in the equation:
- A -- The overall amplitude of the sound.
- c -- The carrier frequency.
- I -- The index of modulation (amplitude of the modulating
sinewave).
- m -- The modulator frequency. Sidebands are
generated in +/- m hertz steps from the
carrier frequency.
|
- FM Modulation (2): If the carrier is 400 Hz, and the modulator is 100
Hz, and the index of modulation is 3, what is the pitch of the resulting
sound? Listen to the output of your lab program if you don't know.
| Answer: |
Here are the frequencies which will be generated with the given
settings:
400 Hz   500Hz  600Hz  700Hz  800Hz   900Hz (positive sideband)
         300Hz  200Hz  100Hz    0Hz  -100Hz (negative sideband)
This will create a harmonic spectrum for a note with a pitch at 100
Hz. Here is the actual spectrum which is generated:
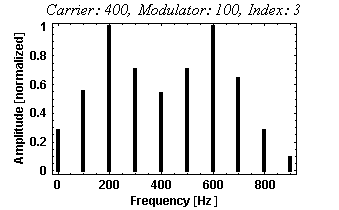
|
- Wavelength and Frequency: You thought you would never see
a question like this again, but... Bats (depending on the species) can hear
up to 150 kHz. What is the size of the smallest bug a bat can catch?
Assume that they are using 100 kHz to echolocate their prey, and it
takes 3 wavelengths of that frequency to detect reflections of the
sound off of the bug, and the speed of sound in air is 350 meters/sec.
| Answer: |
    350 m/s
   ---------- * 3 = 1.05 centimeters
    100,000/s
|
- Extra Credit: Why do I say that the bat's prey must be 3 times
bigger than the detecting frequency? Larger bats use lower
frequencies than smaller bats for finding prey, why might that be
a reasonable situation?
| Answer: |
Bugs which are as large as one sound wavelength will not reflect
that wavelength very well. It has to be a little larger in order to
reflect sound back to the bat (unless the bat is very close).
Larger bats need to eat larger bugs to stay alive (or they only eat fruit,
so they just need echolocation to avoid hitting trees). Since they need
to eat larger bugs, they do not need to hear as high as smaller bats in
order to catch a meal.
|
|


